Property management can be a grind. It is challenging to get ahead of the needs of tenants. It’s hard to avoid that distressing feeling that you’re energy costs are too high each month. There’s also something draining about daily calls and issues that require you to react. You may find yourself asking: “How can I keep tenants happy while also keeping operating costs down?” Or maybe: “Is there a better way?”
Whatever your management experience, you know it’s important to be proactive. Great parents and teachers develop a sense of what’s “about to happen.” They can see a potential problem and act before the conflict occurs. Though this constant awareness may seem exhausting, it allows the environment to be relatively peaceful. Now, imagine having a resource that can provide the kind of information that makes your life easier. One that tells you when an issue is “about to happen.” By scanning and analyzing your building’s performance, Analytics brings this sense of constant awareness to help you see what’s on the horizon. It is a better way to live than fixing the snowballing consequences of what broke last Thursday. Or worse, paying the sixth month of high energy bills and not knowing how to fix it.
The Addition of Analytics
When it comes to building automation system controls temperature setpoints and proper ventilation, Analytics goes a step further than current systems by revealing trends and places where a control could be improved. Your current light switches handle the on and off, but Analytics can show patterns of use and suggest ways to lower costs without impacting function. Current systems may be ideal for day-to-day operations and maintenance, but Analytics is ideal for the future of your building. It provides the proactivity necessary to create the most efficient program over time.
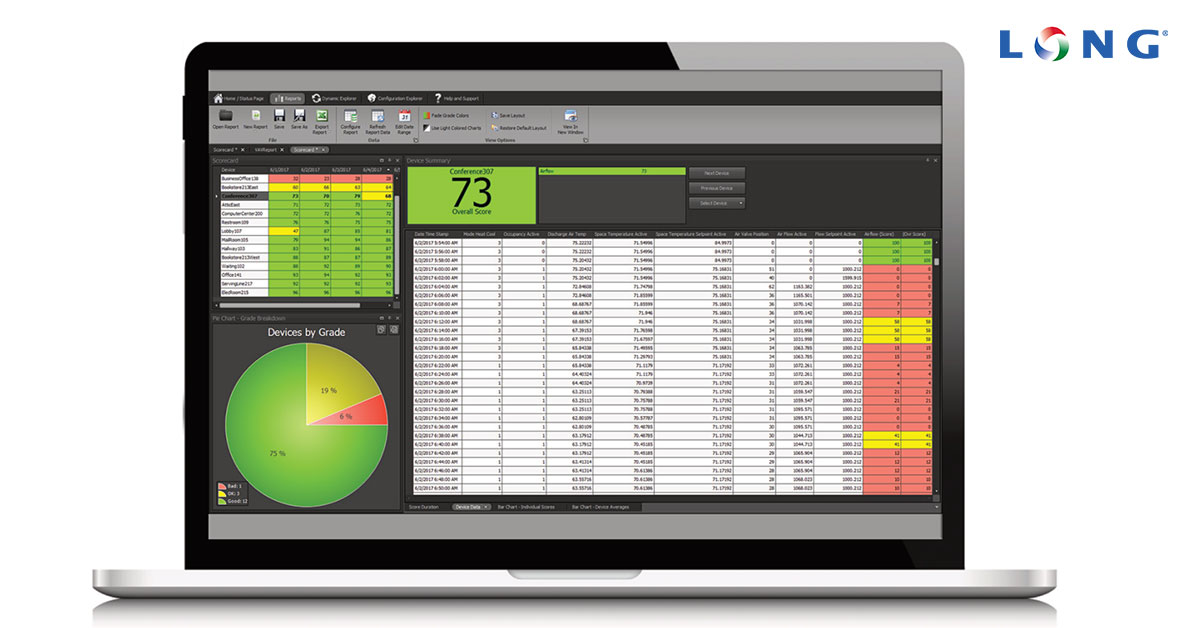
There are three primary components: sensors for data collection, a small CPU which interprets and organizes the data, and a digital dashboard to show you the results. Many modern HVAC units have this type of sensor built in. Your system may require the addition of a dozen or more small sensors, either wireless or connected by a low-voltage cable. These sensors will tie into a central computing device where the data is compiled and analyzed.
The dashboard lays out performance reports and allows you to quickly understand what’s happening in your building. Depending on the platform you choose, you might see equipment ratings, airflow patterns, or highlighted problem zones. The Analytics program shows more than you’re likely to need every day, but it’s possible to create reports with only what you need to know.
Specific Benefits of Analytics
“I’m dying over here, it’s like 1000 degrees in my space!” It’s no fun to get a call like this, and even less fun trying to figure out what happened and how to fix it. Even a great technician can burn hours looking for the problem. Instead, imagine getting an alert from your Analytics program the day before saying “Low Air Flow – Send technician to Sudbury Center 229, 1st Floor, East Corridor.” You send a technician with a comprehensive report of the last five days, which details two related issues causing the problem, and the repair is quickly completed. Now picture yourself with extra free-time, spending it out on the slopes or at a Rockies game with your family. Analytics not only provides both reduced tenant complaints and reduced technician costs, but reduced stress for yourself.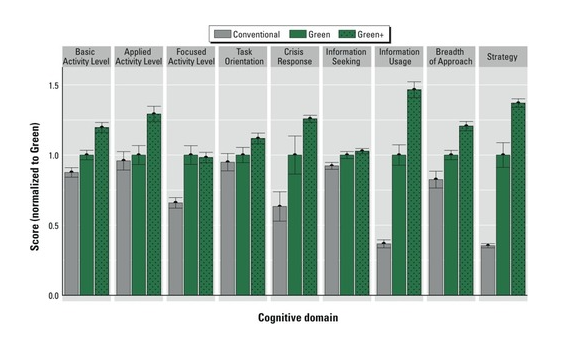
Problems tenants can see and feel are only one part of the picture. Joseph Allen, with the Harvard School of Public Health, has published a study on cognitive function in office workers which found that “on average, cognitive scores were 61% higher on the Green building day and 101% higher on the two Green+ building days than on the Conventional building day…for all nine functional domains.”* If you’re not operating a Green or Green+ building, it’s probable your tenants are suffering the effects of poor indoor air quality. Outside of costly engineering and analysis, how would you know? Tenant health and wellness is a core benefit of having Analytics overlaid on your building automation system.
Another real factor in property management is the operating expenses. “In 2004, Lawrence Berkeley National Laboratory estimated $18 billion per year of potential savings from commissioning throughout the United States (Mills et al. 2004). Analysis of a study published a year later suggests a potential savings for the top 13 (of 100) typical commercial buildings faults alone at $3.3–$17 billion per year…the potential is considerably higher today.”** So if you are thinking there must be ways to reduce energy use and costs each month, you are not alone.
Analytics can help you find those savings. A service like this, described by LBNL as measurement-based commissioning (MBCx), produced savings of between 2% and 25% in a study of 34 buildings from 2006-2009. An average value after cost for those projects was $1.00 per square foot per year. That means a 50,000 sq. ft. building saved an average of $50,000 per year, after paying for Analytics and the recommended adjustments.*** As HVAC and lighting systems grow in complexity, the potential savings continue to increase.
Moving Forward
If you could lay out all the decisions in front of you today, this one would rise to the top. If you are looking for reduced complaints and stress, improved tenant health and wellness, and lower operating expenses, Analytics may be a good fit for you. I invite you to contact a service provider you trust and see what is possible for your building.
* https://ehp.niehs.nih.gov/doi/10.1289/ehp.1510037 page 1
** http://cx.lbl.gov/documents/2009-assessment/lbnl-cx-cost-benefit.pdf page 7
*** cx.lbl.gov study page 49-50
Topics
Subscribe to Updates